The Compassion in Action Dashboard:
See Compassion Made Visible
Not a leaderboard. A dashboard.
Not who is winning over others.
How we are winning together.
The Compassion Games: Survival of the Kindest are underway, and something beautiful is beginning to take shape.
Compassion is becoming visible.
Across the world, people are serving neighbors, restoring places, caring for animals, healing relationships, protecting the Earth, sharing wisdom, creating beauty, building partnerships, and strengthening communities.
Each act matters.

And when those acts are reported through a Compassion in Action Report, they become part of a larger living picture.
That picture is revealed in the Compassion in Action Dashboard.
Not a Leaderboard. A Dashboard.
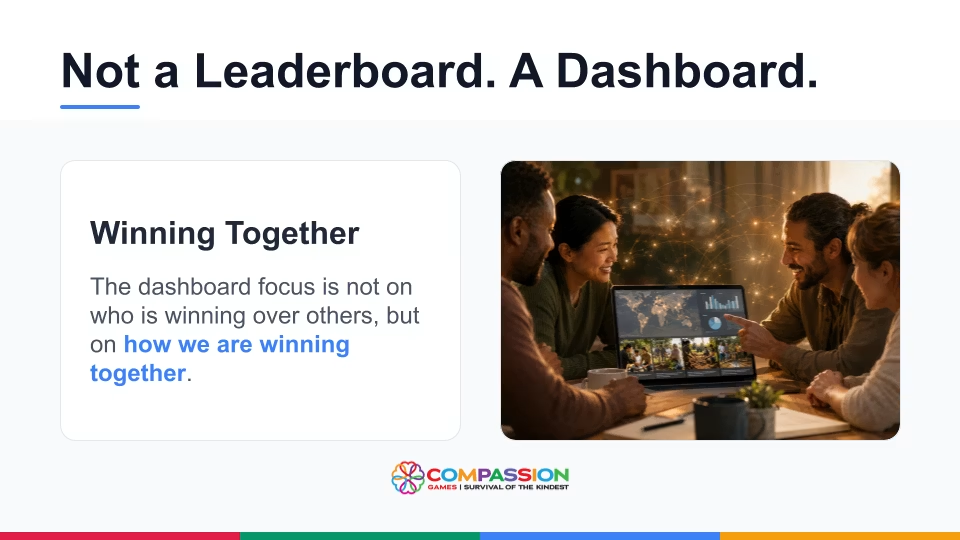
The dashboard is the shared instrument panel of the Compassion Games.
It does not rank people. It reveals the field.
A leaderboard asks:
Who is ahead?
A dashboard asks:
What is happening? What are we learning? Where is compassion growing? Where is compassion needed next?
That distinction matters.

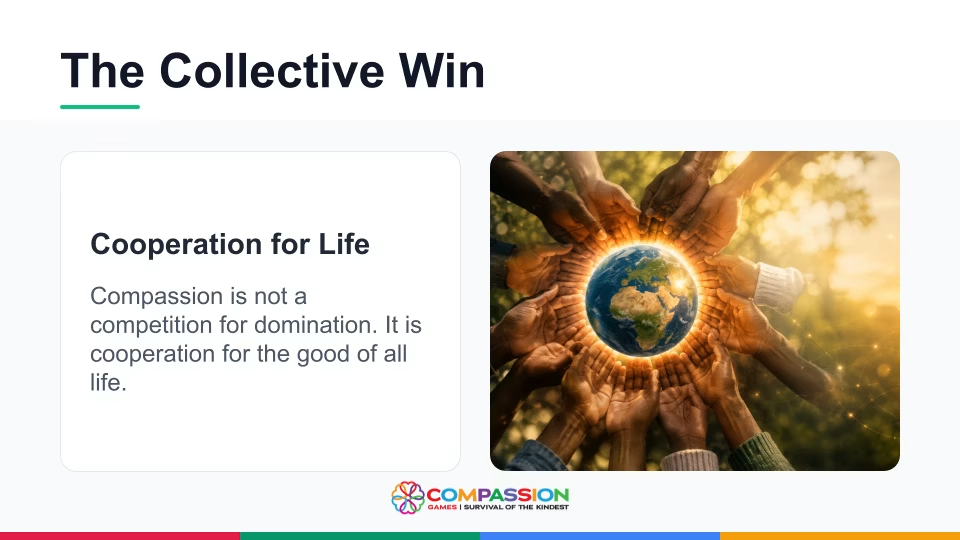
The Compassion Games are not a competition for domination. They are a cooperative game of shared impact.
We are not trying to prove who is better than anyone else.
We are discovering who can work together most effectively for the good of all life.
That is why we use a dashboard.
Seeing the Whole Field of Play
The dashboard helps us see the whole field of play.
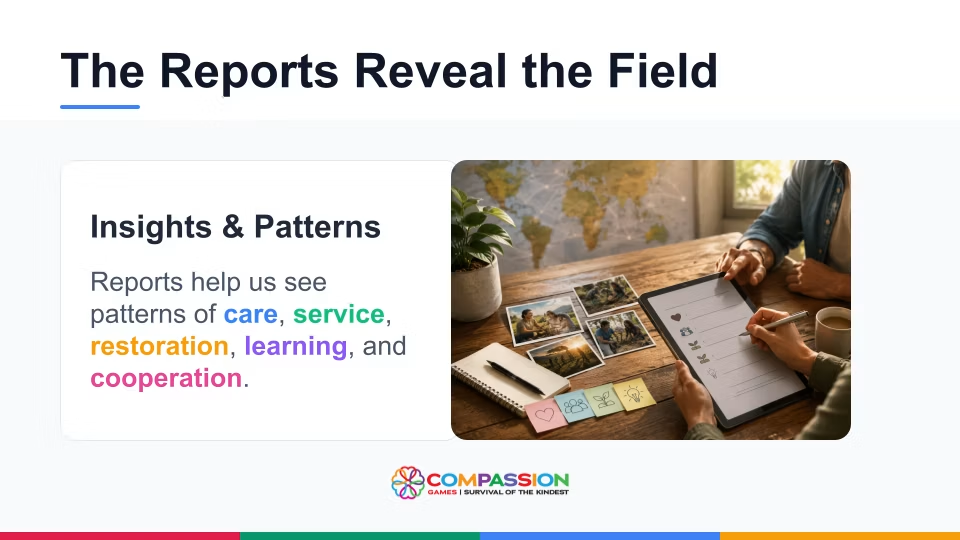
Every Compassion in Action Report adds another signal: a kindness offered, a persn served, a place restored, a practice completed, a partnership formed, a story shared, a community strengthened.

Together, these signals help us see the collective win emerging through people, teams, communities, bioregions, and the world.

The dashboard turns individual acts into a living picture of global compassion.
It helps us move from isolated goodness to coordinated care.
It helps us recognize that we are not alone.
From Individual Acts to a Larger Pattern
- Someone feeds a neighbor.
- Someone restores a garden.
- Someone hosts a healing circle.
- Someone supports an elder.
- Someone protects water.
- Someone reaches across a divide.
- Someone teaches a child.
- Someone cares for an animal.
- Someone plants a seed of peace.
- Each act is meaningful on its own.

But when we report these actions, they begin to reveal something more: a pattern of compassion moving through the world.
This is how the invisible becomes visible.
Numbers and Stories Together
The dashboard gathers both numbers and stories.
The numbers help us see what is growing:
actions taken, people reached, hours served, places cared for, partnerships formed, and reports submitted.
The stories help us feel why it matters.

They show the courage, care, creativity, and cooperation behind the numbers.
They remind us that compassion is not an abstract idea. It is something people do.
It is something communities practice. It is something we can organize, strengthen, and grow.
What You Can Explore
The dashboard includes ways to explore the field of compassion in action.
You can see totals, search reports, filter by bioregion, explore action types, view the report map, and discover stories from the field.
Reports may include many forms of compassionate action, including:
- Direct service and mutual aid
- Environmental restoration
- Education and mentoring
- Health and healing
- Community care
- Care for animals and all life
- Peacebuilding
- Arts and ceremony
- Organizing and advocacy
- Place stewardship
- Local resilience

All of this helps us learn together.

Where is compassion already flowing?
What kinds of actions are people taking?
Which communities and bioregions are emerging?
What stories can inspire others?
What partnerships are forming?
Where might we be called to act next?
In this way, the dashboard is more than a display.
It is a guide.
Why “Dashboard”?
The word “dashboard” once referred to a board on a carriage that protected riders from mud and debris dashed up by the horses’ hooves.
Over time, it became the instrument panel that helps a driver see what is happening and navigate well.
That meaning is perfect for the Compassion Games.
The dashboard helps protect us from the mud of invisibility, isolation, and despair. It helps us see the living field of compassion in motion.
In a world where so much harm is visible, the dashboard helps make care visible too.
It shows us that people are still choosing kindness. People are still showing up. People are still protecting life. People are still building a more compassionate and regenerative world.
And we can join them.
The Dashboard
There is also a simple rhythm inside the word DASH:
D — Do an act of compassion.
A — Add your Compassion in Action Report.
S — See the larger pattern on the dashboard.
H — Help compassion grow by inviting others to play.
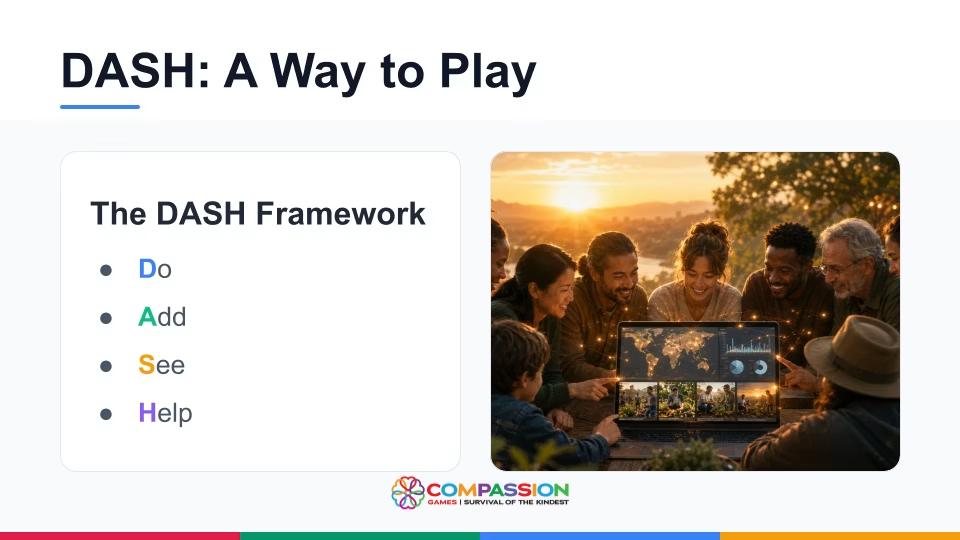
Do. Add. See. Help.
That is the DASH in Dashboard.
This is how we play.
We take action.
We report what happened.
We learn from one another.
We celebrate what is emerging.
We invite others into the field.
We keep compassion in motion.
Where Compassion Becomes Visible
The Compassion in Action Dashboard is where we see the collective win.
It is where acts become signals, signals become patterns, patterns become stories, and stories become invitations.
It is where compassion becomes visible.
Visit the Compassion in Action Dashboard.
Then submit your own Compassion in Action Report.

You may submit as many reports as you choose.
A report can share a single act of kindness, a team project, a ceremony, a restoration effort, a reflection, a partnership, or a larger community action.
There is no need to wait until everything is finished.
If compassion was brought to life, it can be shared.
Together, we are learning how to see the field, strengthen the field, and grow the field.